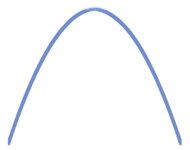
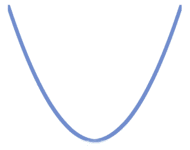
These are the images of the graphs I want to know the academic names:
I've googled and learnt that their names are Concave Down Curve and Concave Up Curve. However, I want to know if there are any other names for these graphs as I want to use them in a sentence like:
"The sales from 2011 to 2017 resembles a concave down curve with the lowest point being 2015 at 20,356 sales"
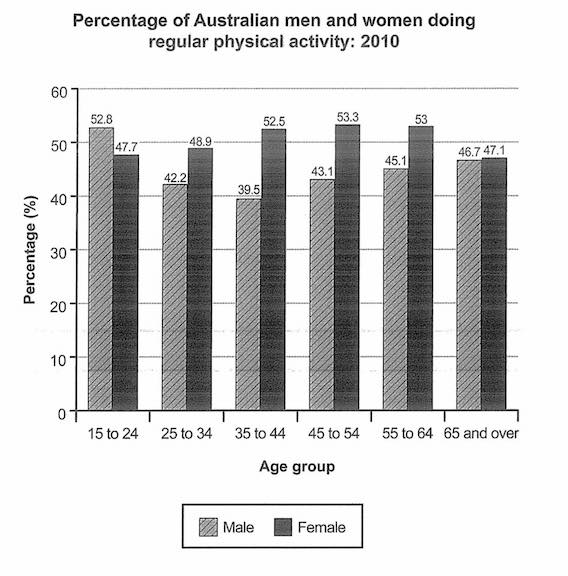
Edit 1: Guys, thank you for your inputs. However, my question was not that related to math, but was to find a good descriptive sentence for my IELTS writing. Here is the graph I came across in the test:
I noticed that, as people get older, women tend to do more exercises, and then less, their trend shapes like a bridge, while a reversion of that can be seen in men. Now, if I were to compare these two trends while trying to sound academic, should I write something similar to the following?
"A demographic trend which resembles a concave down curve can be seen in women's figures while it is the opposite for men's"
Could you guys give me a more well structured and better sentence without sacrificing the "concave down curve or u-shaped curve" because I really want to include those terms.


